Transforming Data Stories into Business Decisions.
Business Analyst and BI Consultant, bridging the gap between business needs and data insights — from strategy and governance to user-focused analytics.
Explore Case StudiesQuantified Impact
Reduction in Reporting Time
Streamlined data preparation and automated reporting workflows.
KPI Consistency
Defined data quality and governance standards in strategic reports.
Improvement in Usability Score (UX)
Applied UX/UI design principles to executive dashboards.
Featured Projects
Marketing Insight Dashboard
A 360° view of marketing performance. This dashboard consolidates data from five campaigns to monitor platform results and total sales, uncovering the most valuable customer segments to optimize marketing investment.
Help Desk Performance Dashboard
A Help Desk dashboard designed for managers. It splits the view between Ticket process KPIs and Agent Performance to quickly identify bottlenecks and team support needs.
COVID-19 in Europe: Analysing the Pandemic's Effects
An end-to-end analysis of the COVID-19 pandemic. This project combines QGIS geospatial mapping with Power BI statistical analysis to identify key trends and critical outliers in Europe.
The Story Behind the Analyst
1. The Foundation
My foundation is in communication: learning to investigate, find the most important angle, and build a compelling narrative.
2. The Pivot
But a good story needs evidence. My path wasn’t linear: moving to London showed me the gap between how businesses speak and how customers behave.
3. The Toolkit
That realization led me to pursue a Master’s in Consumer Analytics at the University of Leeds, where I built the technical toolkit to turn stories into data — and data into clarity.
That "Communication-First, Data-Powered" background is my competitive edge in BI.
Whether I'm cleaning a dataset or building a dashboard, my focus is always on the audience and the actionable narrative.
Because data is only valuable when it's understood.
Experience & Education
Work Experience
Business Intelligence & Data Analytics
MarkTech Industry | Aug 2021 – Sep 2025. Spain (Remote)
- Led full-cycle BI projects — from advanced data modeling and ETL design to building high-impact, user-centered dashboards that turn complexity into clarity.
- Served as the main BI partner for business stakeholders, turning complex needs into clear technical solutions, defining KPI governance frameworks, and delivering actionable, data-driven insights.
Assistant Manager
Fullers | Mar 2017 – Aug 2018. UK (London)
- Led multicultural teams and enhanced operational efficiency in a high-pressure, English-speaking environment.
Education & Training
Data Visualization Program
Escuela de Organización Industrial (EOI), Spain | 2023
Specialized training in advanced dashboard design and data storytelling.
MsC Consumer Analytics & Marketing Strategy
University of Leeds, UK | 2018 – 2019
Built expertise in data-driven strategy, predictive modeling, and consumer behavior analysis to bridge insights with action.
Degree in Journalism & Mass Media
University of La Laguna, Spain | 2009 – 2013
Foundation in communication, research, and data analysis. Learning to uncover insights and craft narratives that connect data and people.
Data Skills & Consultancy
Data Strategy
I transform data management into a competitive advantage, designing structures and strategies that drive business decisions.
- BI Use Cases aligned with business goals
- Data Governance and KPI documentation
- Analytical maturity assessment
Analytics & Automation
I combine technical tools with analytical thinking to convert data into useful information and efficient processes.
- Data modeling and advanced SQL
- ETL with Power Query and Python
- Executive Dashboards in Power BI
Communication & Storytelling
Data is only useful if it's understood. I specialize in user-centered design to translate complex analysis into clear, actionable insights.
- User-centered dashboards (UX BI)
- Data storytelling for executive level
- Executive results presentations
Tech Stack

Power BI
Visualization

Excel
Analysis · Reporting

SQL
ETL

Python
EDA · Data Prep

Jira
Agile Management

Figma
UX/UI Design
My Blog: The "Why" Beyond the Data
CF VizTech is my personal project — a space to bridge the gap between data and decision-makers. My goal isn't just to show how to build dashboards, but to explore the why behind them. This is my collection of articles on the process, strategy, and design that bring data to life for any role.
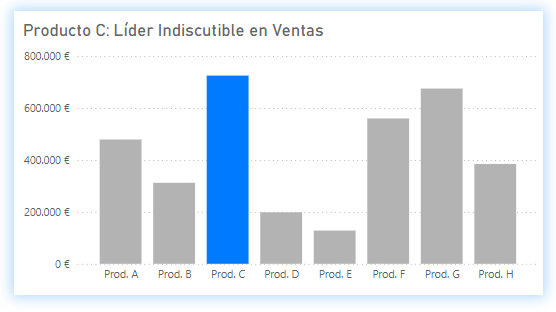
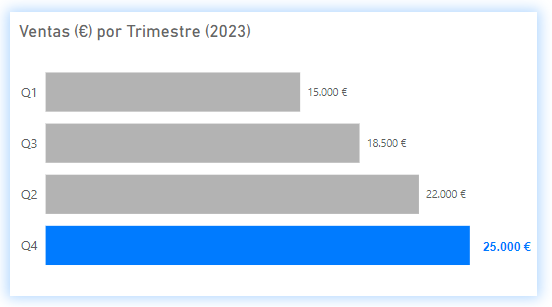
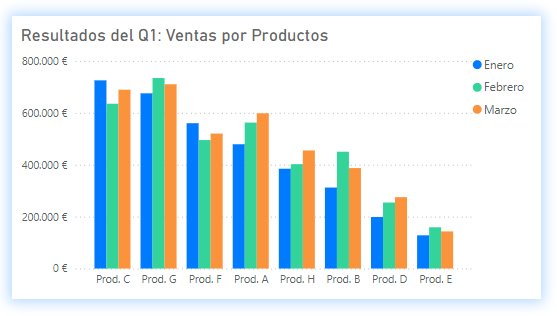
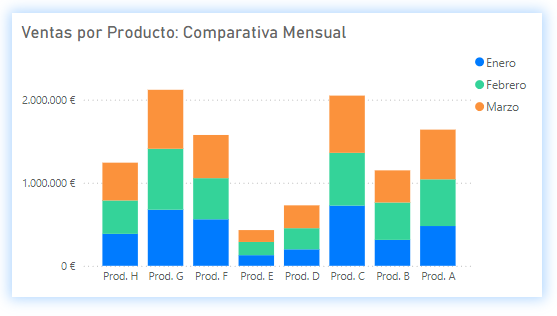
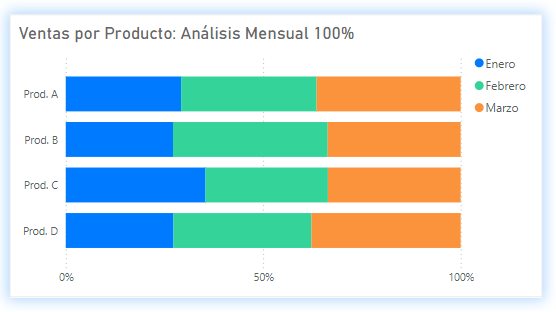
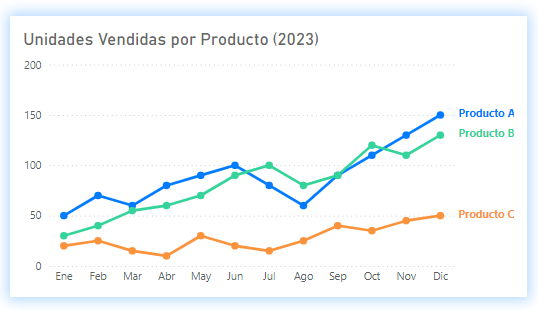
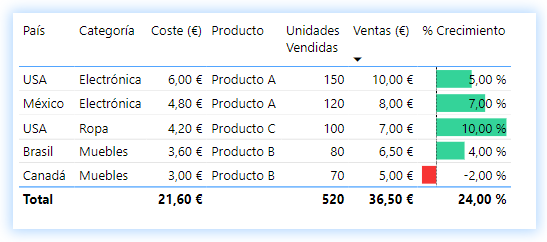
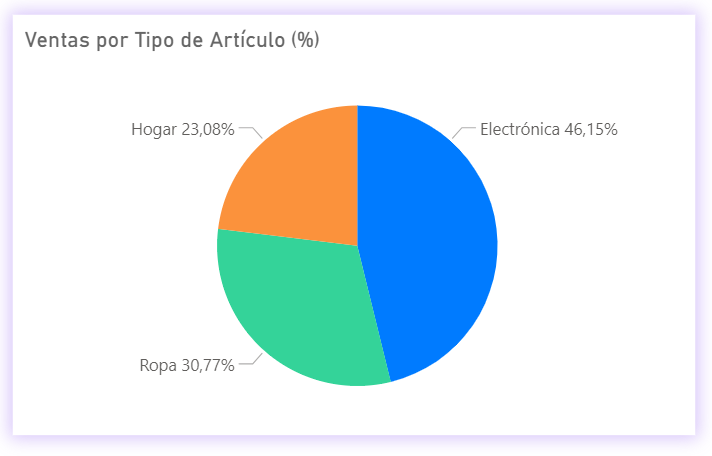
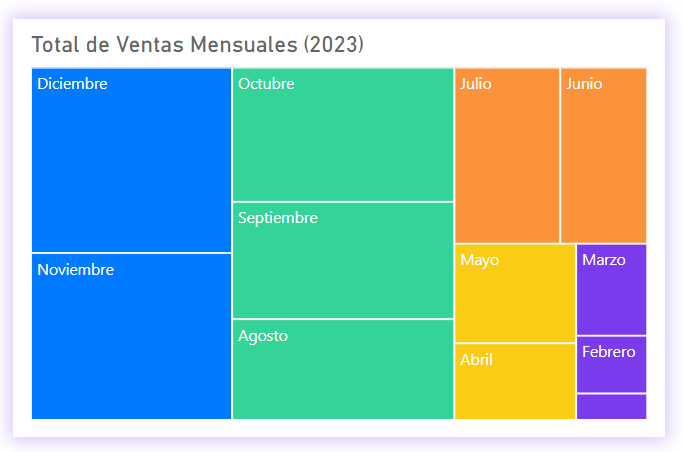
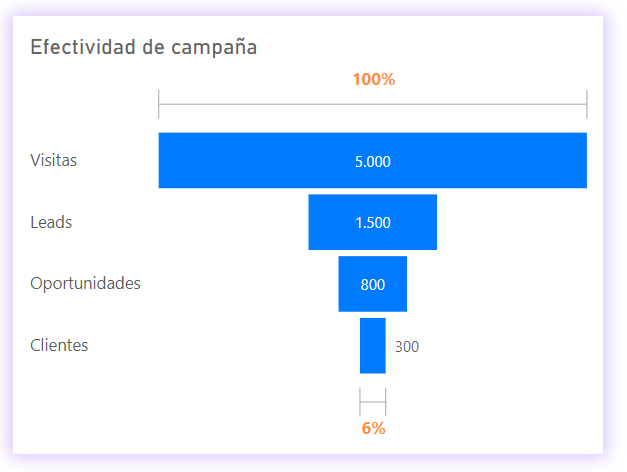
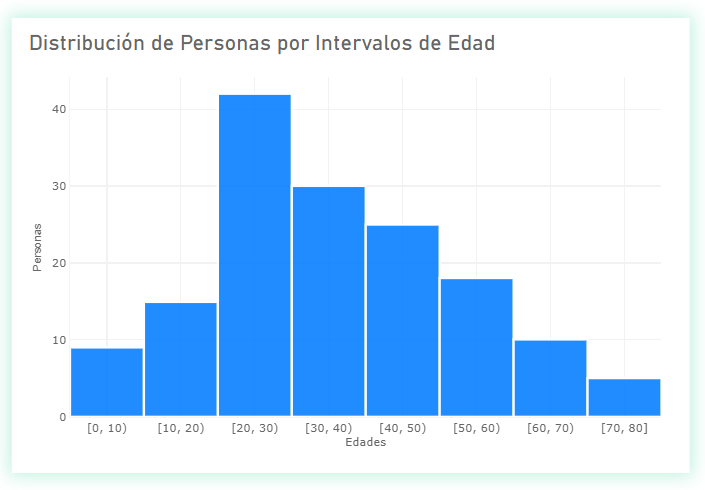
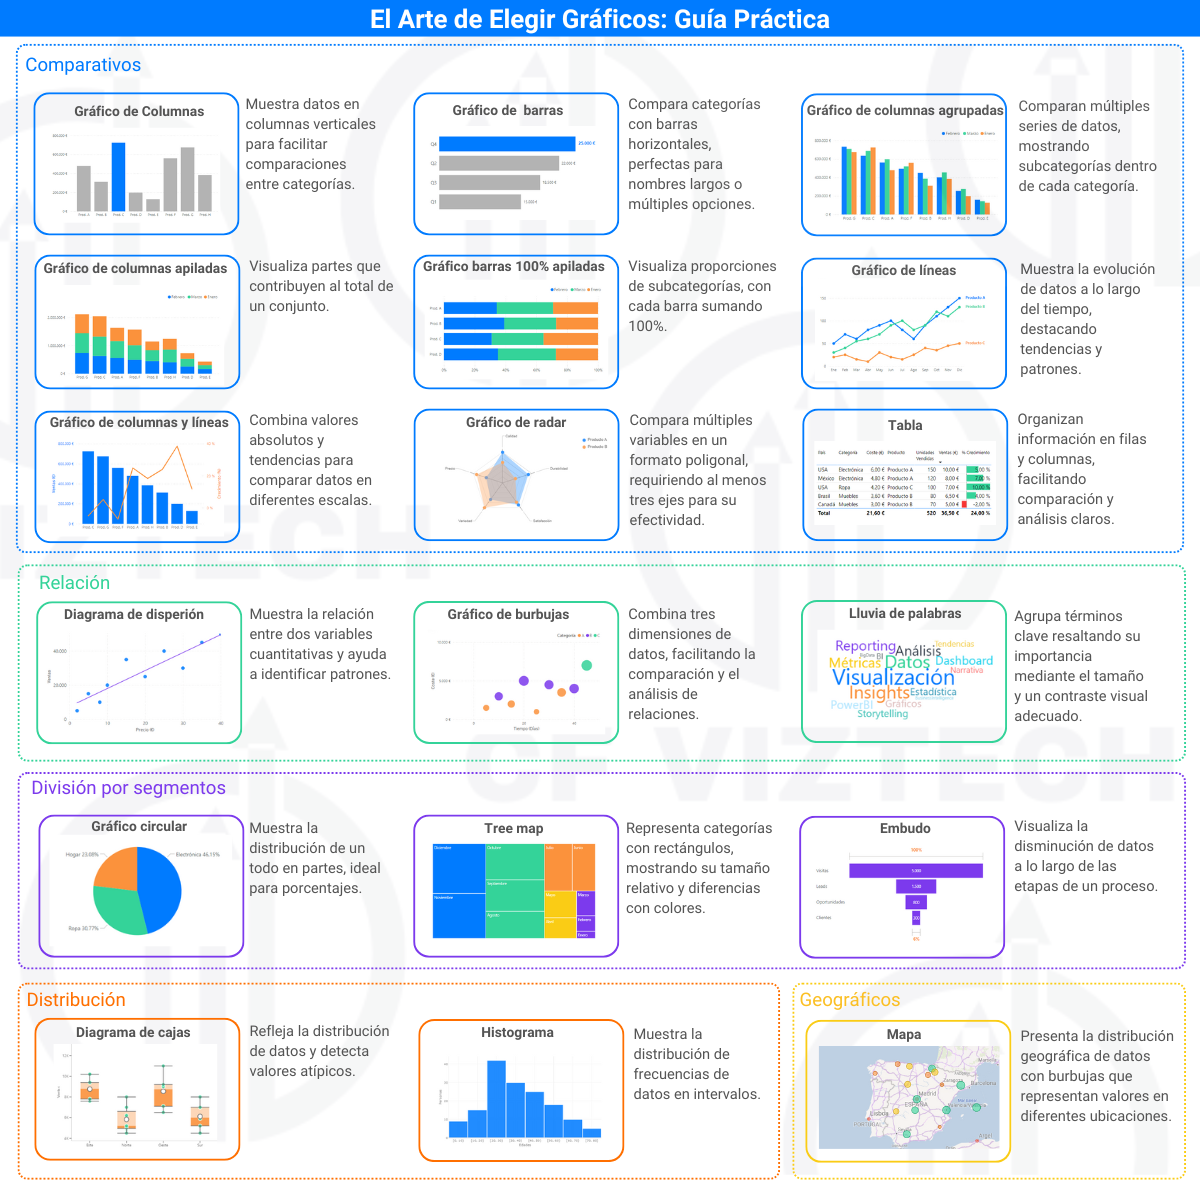
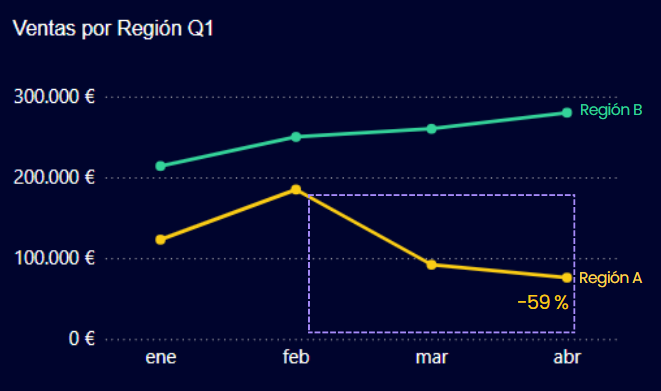
The Art of Choosing Charts (Part I)
A practical guide to comparative charts.
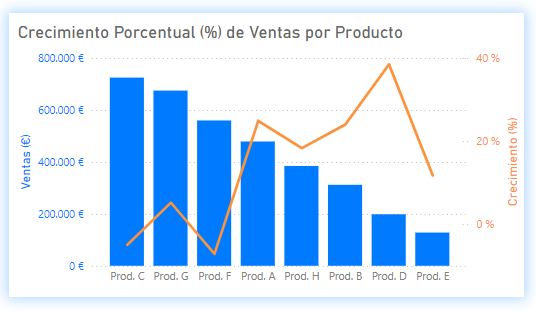
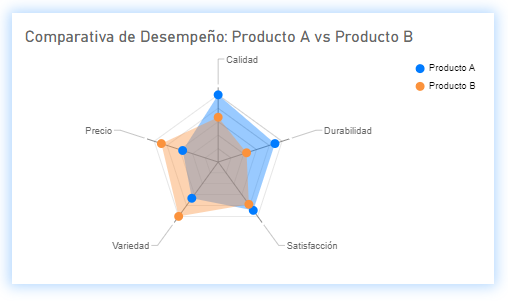
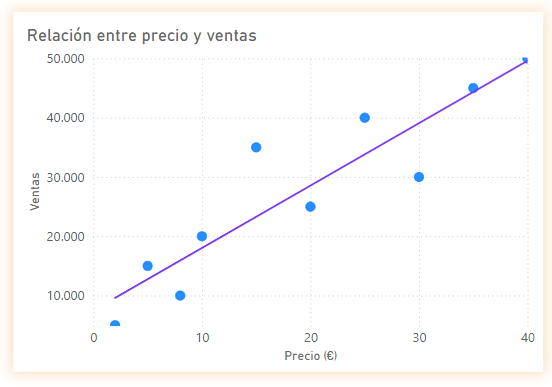
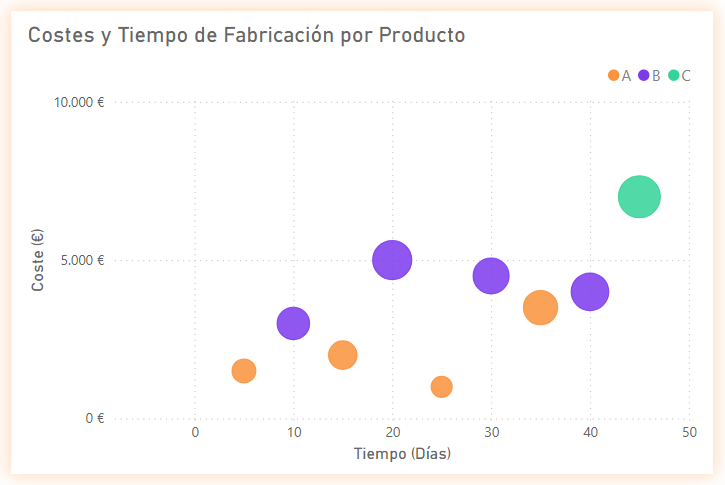
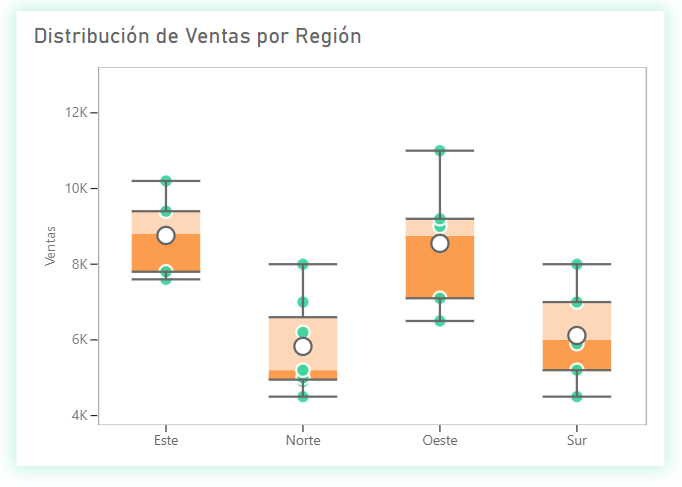
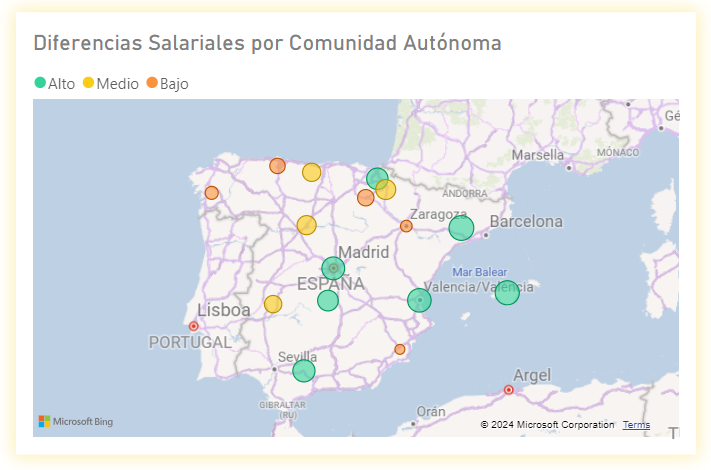
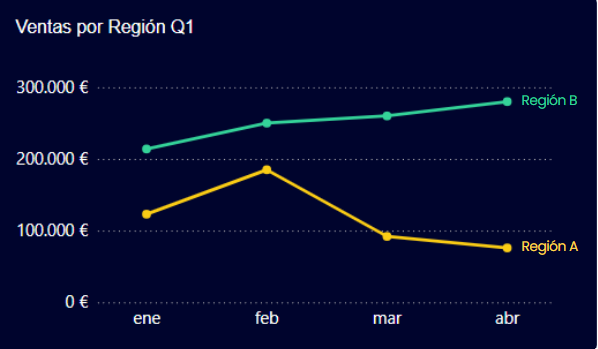
The Art of Choosing Charts (Part II)
Charts for relationship, distribution, and more.
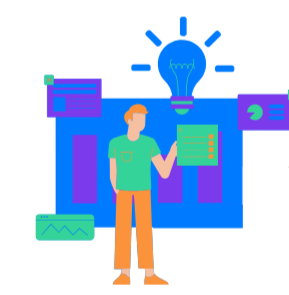
5 Steps for Data Storytelling
Turn your data into stories that persuade.
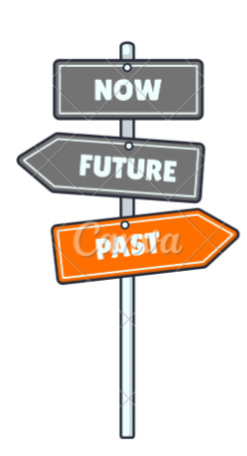
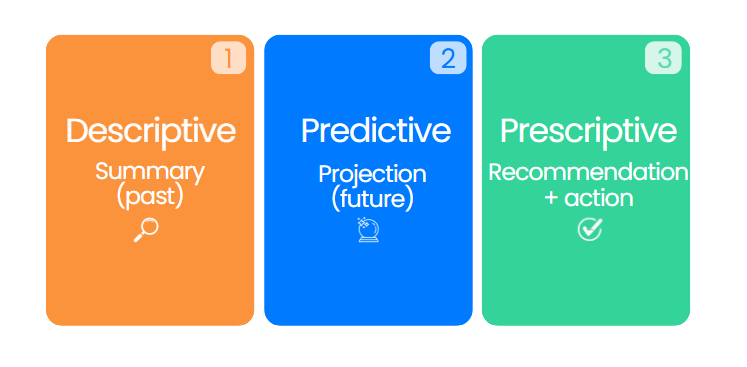
The 3 Types of Analysis in BI
From Descriptive to Prescriptive: turn numbers into strategy.
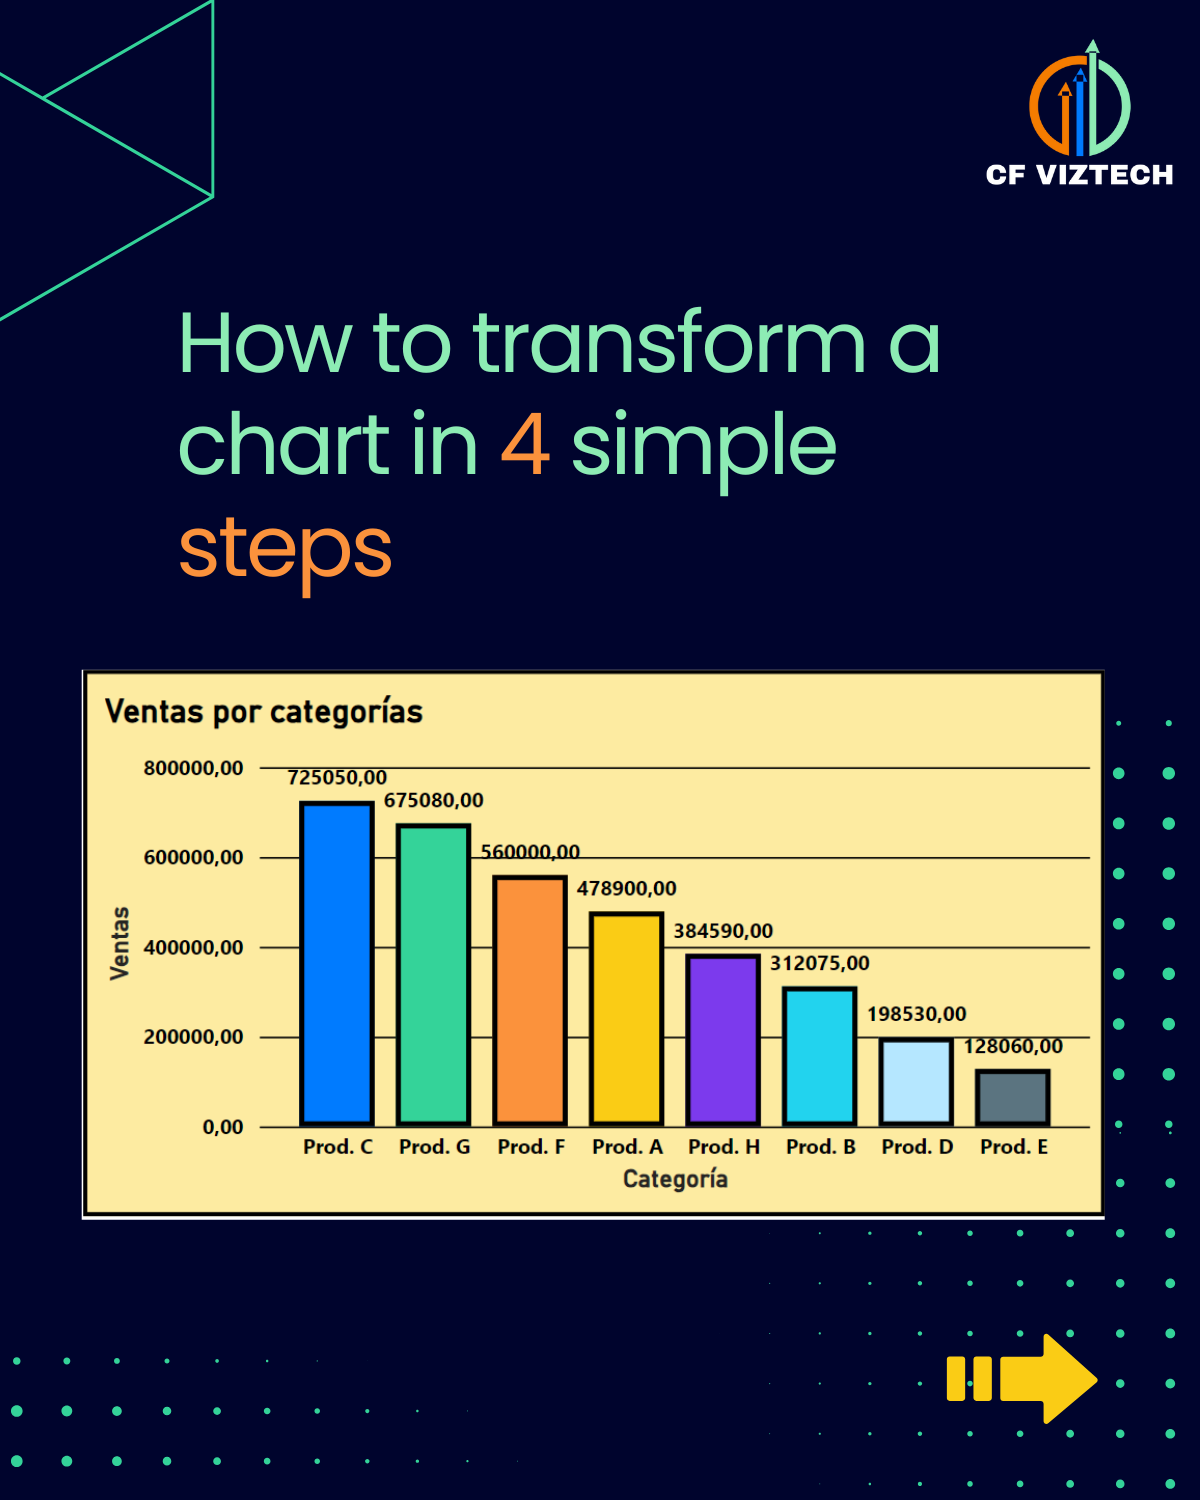
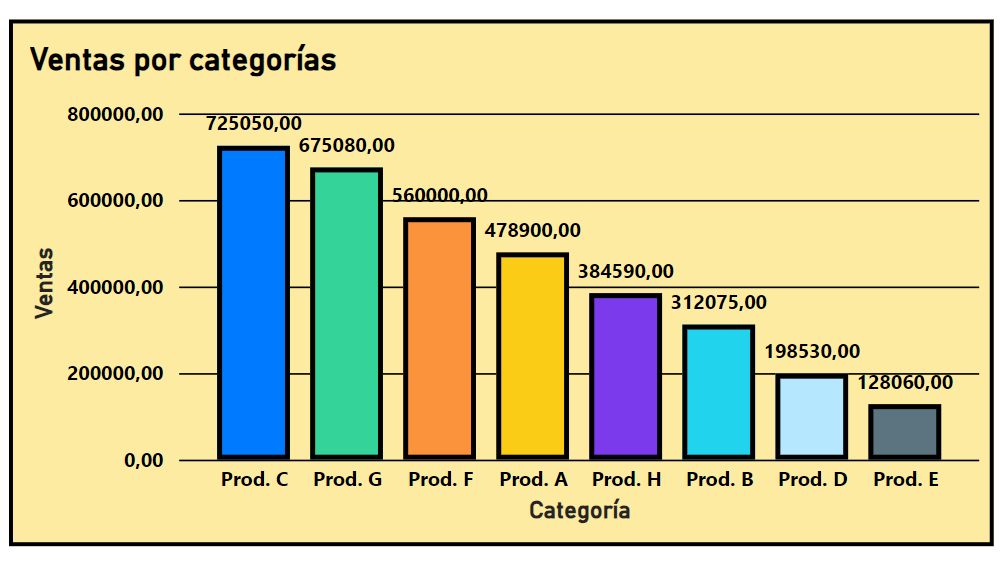
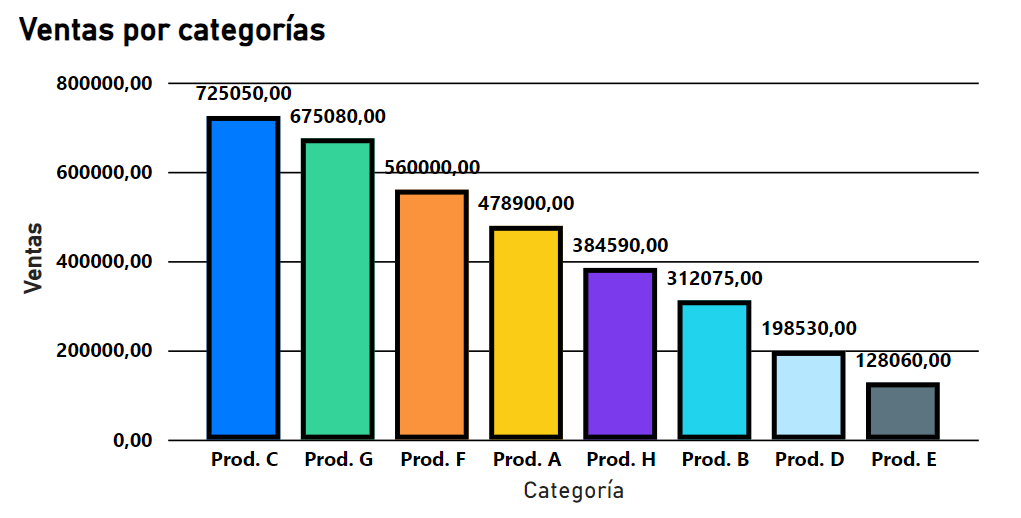
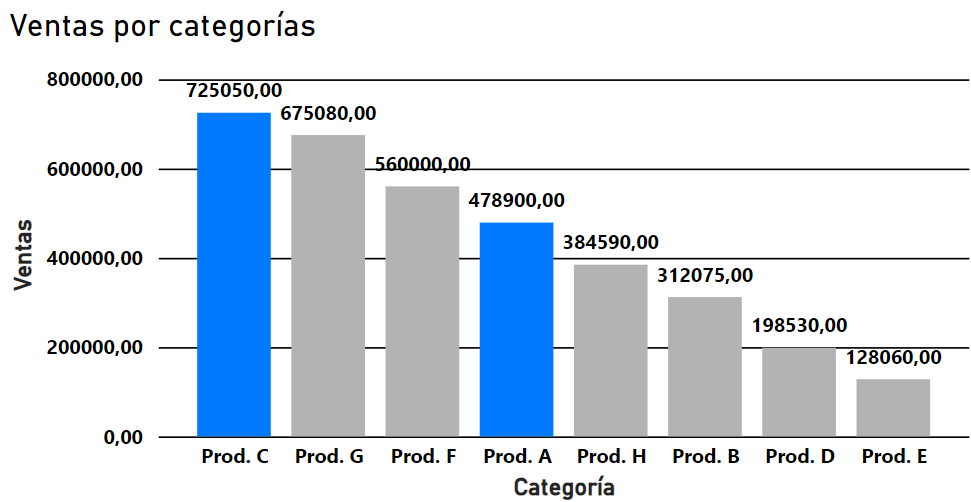
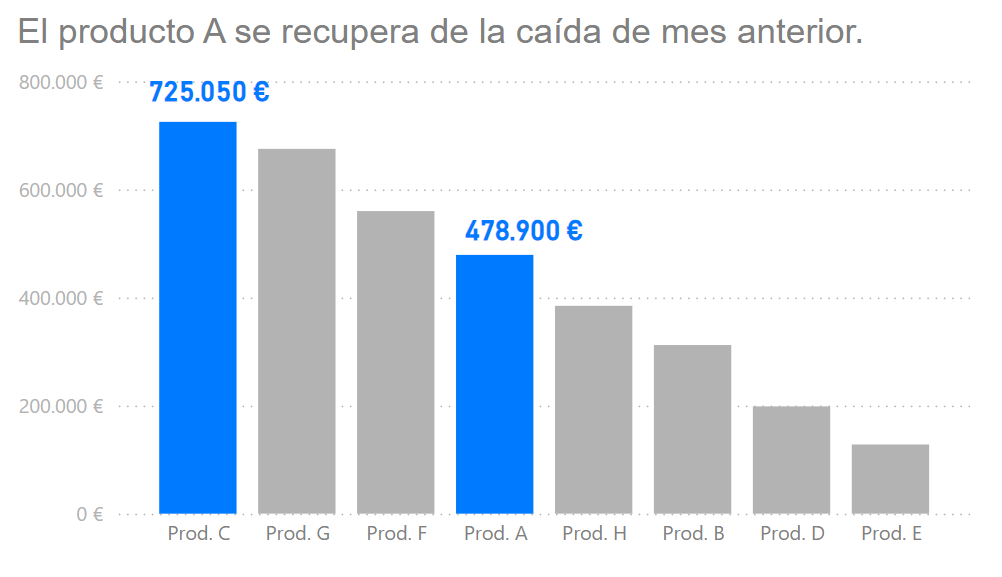
How to Transform a Chart in 4 Steps
A "before and after" to improve your visualization clarity.
Let's talk about your next data challenge.
I’m open to new opportunities where I can combine data strategy, analytics, and storytelling to create business impact. Available for remote or hybrid roles — always happy to discuss how data can tell your next story.
catherinefarkas1@gmail.com